EVALUATING WORKSPACE NEEDS
User Research
7 MIN READ
The Low Down
I worked with a team as a user experience researcher to perform user research to evaluate the workspace needs of digital freelancers and post-secondary students within the downtown Toronto area. I created and distributed a survey and worked with the team to conduct user interviews that enabled our team to collect both quantitative and qualitative data. Our ultimate goal was to inform design recommendations for a digital tool to respond to the challenges faced by our user groups seeking out public workspaces.
TYPE
ACADEMIC WORK
SURVEYMONKEY
XTENSIO
STICKY NOTES
TOOLS
METHODS
INTERVIEWS
SURVEYS

Research poster outlining project questions and solutions
WANT A CLOSER LOOK ATHE POSTER? CLICK HERE
or
WANT A MORE IN DEPTH LOOK AT THE REPORT?
CLICK HERE
1.
What factors (e.g., technological, financial, environmental, etc.) influence the features digital freelancers and post-secondary students look for when seeking a workspace?
2.
What challenges do digital freelancers and post-secondary students currently face when searching for a workspace?
3.
Which features of digital resources (e.g., apps, forums, blogs, search engines, etc.) provide users with ease of use through findability and clarity of information when locating a workspace?
Our team was challenged to address a perceived knowledge media design problem and perform user research that would inform the design of a digital tool. Essentially, we needed to find something that we thought needed to be changed/fixed ASAP! Selected was the public workspace needs of digital freelancers (freelancers that use digital tools for their work) and post-secondary students. We hoped to gather greater insight into the needs, expectations, and problems they currently encounter. After the completion of a literature review (got that background knowledge), our team developed the following research questions to investigate:
The Challenge
The Process
With our research questions in hand, we set out to find the answers to our questions. We began with the users (a very good place to start).
DATA COLLECTION
We had a total of 49 participants partake in interviews and in an online survey. My team and I conducted 12 interviews with our two user groups, Digital Freelancers and Post-Secondary Students (6 from each), to find answers to our proposed research questions. We recruited participants by liaising with Facebook groups, distributing our screener at the Centre of Social Innovation, and distributing flyers at coffee shops, coworking spaces, and at the OCAD campus.
I also developed a survey using SurveyMonkey that our team distributed to participants recruited on social networks (Facebook and Instagram), freelancer forums, LinkedIn, meetup.com and ASKTO. Responses to the survey contained 15 Digital Freelancers and 22 Post-Secondary Students.
Through our recruitment process, we found it easier to recruit Post-Secondary Students as we ourselves were students that had easy access to other students on campus or within the city. The difficulty recruiting Digital Freelancers allowed us to experience not always having participants handed to us so easily and finding more creative ways to recruit participants.

Instastory post recruiting for survey data collection (great easy method of recruitment)
We then translated our user groups into user personas, one for each user group:
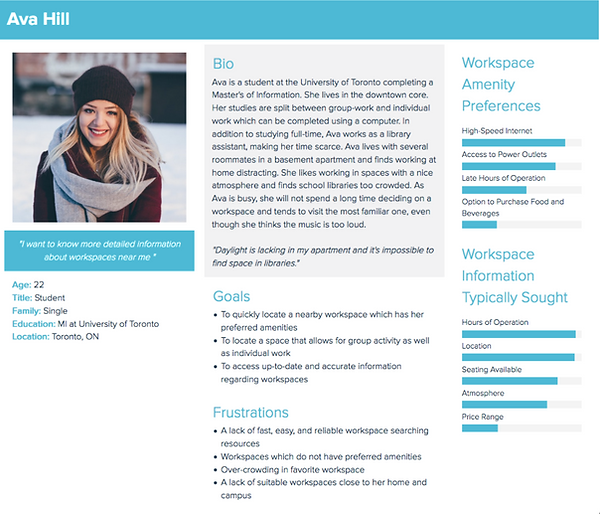
Post-Secondary Student user persona
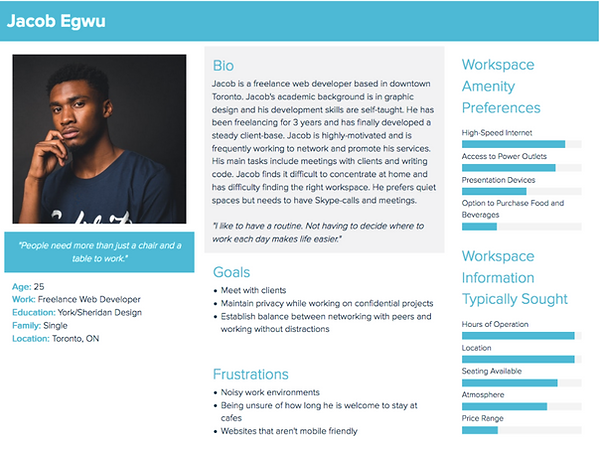
Digital Freelancer user persona
DATA ANALYSIS
To analyze the data, our team locked ourselves in a room for a day and began to look at what the qualitative and quantitative data were telling us.
To analyze the qualitative data retrieved from the interviews, we employed the method of affinity mapping to write down our insights on post-it notes and group them into themes that we found to be prominent (don't worry, we recycled!). We then organized those themes into a rainbow chart and a theme chart to best retrieve the answers to our research questions and any other insights that came to light.

Members of my team first organizing our insights by each user group

Participant data from both Interview and Survey qualitative data organized by themes and subthemes
We analyzed our quantitative data from the survey for each user group, representing outcomes in graphs with frequency/percentage giving us the best insight to our questions. We were able to compare results between the user groups as well to see if there were differences between the groups, and if so, to start thinking about how our team would address them in the design of the digital tool that would address the needs of our user groups.
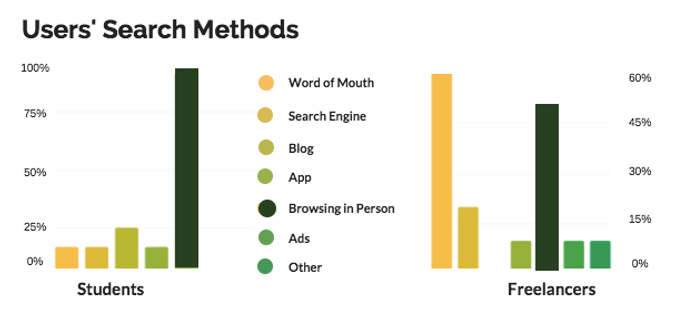
We found that Digital Freelancers and Post-Secondary Students currently differ in the way they search for workspaces, leading us to consider how we can reflect this finding in our design recommendation.
The Impact
SO NOW WHAT?
Now that we had completed our analysis of all the data we collected, we sat together and found that through the interviews and survey, we were able to answer our questions and develop design recommendations. These were formed to inform the design of the resource to solve or lessen the challenges faced by our two user groups. They also provided insight on what features should be included in that resource to enhance the ease of discoverability of public workspaces for our user groups.
DESIGN RECOMMENDATIONS
APP AND/OR MOBILE FRIENDLY
USER PROFILE
with personalized filters
PUSH NOTIFICATIONS
signalling nearby workspaces
WORKSPACE RECOMMENDATIONS
from friends
app features
reviews
geo location
recommendations
photos
filters
ratings
user profile
Our next steps would be to take these insights and brainstorm what the app might look like. We would then begin ideation and move onto creating sketches and wireframes, task analysis, and other forms of user testing to aid in the development of an app. Moving forward, working in an agile environment and continuous iteration, we would provide these insights to a development team and work with them to provide our users with the best user experience!
platform
Want to take a closer look at this research project? Click here
Key Takeaways
EVALUATE YOUR TEAM'S STRENGTHS: Working in a larger group, it proved to be difficult to split up the tasks enough to have every member gain experience in each area. It can also lead to having to take charge in a situation and act as a project manager in many regards, as I found I often had to do during this project.
RECRUITMENT IS HARDER THAN IT SEEMS: Initiating the recruitment process, we thought that everyone would love to want to help students learn through this project. This was not the case: only the kindhearted seemed to respond. I saw the value of providing an incentive but also realized that since, in this case, the participants were not getting an incentive from our team, they truly cared about our topic and about providing insight on the problem we were addressing.